- General
-
 Bugs
Bugs

0
Fixed
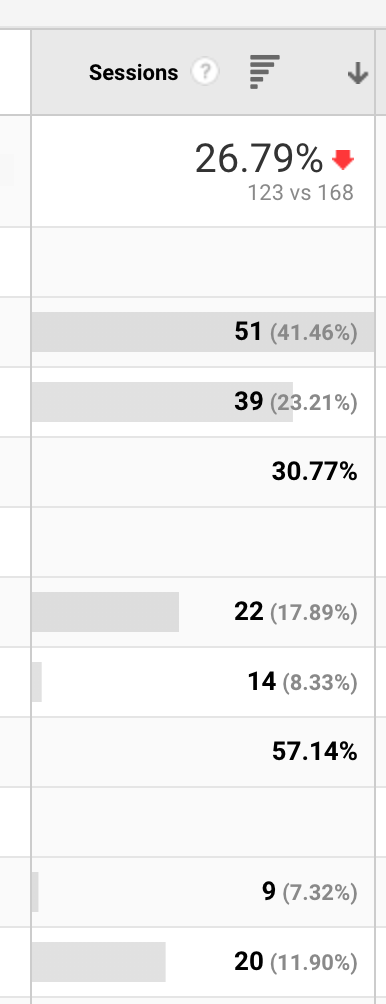
Please don't cut the axis on the bar charts
Have a look at 22 vs 14. There's no way this bar chart is an accurate representation of the data. It is almost a deal-breaker for me
Answer

Under review
No need to throw the deal breaker argument here :)
It's probably an issue when you compare two segments (or two date ranges), I will look into it.
Answer
Fixed
I just made a fix which will be available in the next release.
- When there's a single segment, no date comparison, it will correctly use the column total.
- If multiple segments, it will use the total of the last segment for a given metric (tip: put your biggest segment last).
- If comparing two date ranges, it will use the highest total of the two date ranges.
- If multiple segments AND comparing dates, it will use the highest total of the two date ranges, but only for the last segment listed (tip: put your biggest segment last...) - that one was getting pretty complicated to parse... maybe I will spend more time to fix it later.
Customer support service by UserEcho


I just made a fix which will be available in the next release.