
 Data studio: Jump into field editing from data overview
Editing a custom field (metric) you currently have in use is a hassle! When you select the edit button you just get some display options. I need to click "Create new field" in the bottom right. Then from there do "All fields" then search for the field I want to edit, then i can edit it.
For filters this UX is there. If you add a filter to a table/graph then when you hover over it in the list of filters there is a edit button and you edit that filter directly there. Custom fields (metrics) don't have this, they should!

Well... sadly... after looking into it more carefully, there's no easy way to do it because the field element shown on the page doesn't have any indication if it's a custom field or not. I will park this for now but keep it as a potential feature in the future, once I have worked a little bit more on the more advanced modules which will bring subscribers value.

 Can't access other logged profiles in GTM (Chrome) it always redirect to the default user
I noticed this yesterday, when I was trying to switch to another logged user in Chrome, GTM kept redirecting me to the default user. I had to disable the extension momentarily to be able to change
UPDATE: the issue disappears when I disable the option "RememberMe: Remember last container you were on"

Google Sheets Export - Not Exporting Segment or Filters
Hi,
I've been using the Google Sheets Export option for the first time and I've noticed it does not include the segment i have applied or the filters that I've set in the report when I paste over to Google Sheets
Is something broken or have I not exported it correctly?
Cheers
Good catch! I fixed it, and at the same time I found that some segment IDs listed in the GA interface do not actually match the reporting API segment ids.
For example, All Users in the GA interface is "builtin1" and corresponds to "gaid::-1" in the reporting API, which is easy to handle. But Bounced Sessions is "builtin27" in the GA interface, but is "gaid::-19" for the reporting API... go figure!
This will be fixed in the next release, coming up April 5th.

Google Analytics export tool is not responding
The custom export options Da Vinci provides are not responding. The mouse does not indicate that these are clickable elements and when clicked nothing happens. This is true of built-in and custom reports. I have tried disabling the feature and disabling Da Vinci.
I just checked and the filters are there for dimensions and metrics, for Reporting API v4 and GA Spreadsheet addon. I also recorded a quick demo here: https://www.useloom.com/share/cb8100a272a0480788d4ace47f079e01
While doing my test, I noticed the condition for metrics was there but with the wrong condition - for example, it had METRIC_GREATER_THAN instead of just GREATER_THAN. I just fixed that and it will be ok in the next release.
If you still have issues, please check if there are any errors in your browser JavaScript console, or more info about the query you are trying to build (which report, which segments, filters, etc.) and I will see if I can reproduce it.

 Hide me does not work
I'm running into a problem that I cannot resolve and I can't find a posted description of the problem or the solution anywhere. I've my copy of the DaVinci in Google Analytics Tracking is set to "OFF" (Blocked). When going to my website I see myself being tracked on GA "Real-time." If I close the browser tab that I used to opened my website I continue to show up as a "real-time" user past the 30 second delayed response time. If I close my Google Chrome browser, open it and the go directly to GA (nothing else), I'm still tracking as a real-time user. (?????) The only way I found to remove myself from being tracked in real time on GA is to reboot my laptop. (????!!!!) Got any ideas what could be causing this false real-time tracking?? Thank you....
I just checked again - worked fine for me. I also did a little Loom screen recording to show how it works/what happens: https://www.useloom.com/share/2781aa4b0a254c76a55ceeaa125598db
- make sure you are NOT in Incognito mode - to respect user's privacy, Da Vinci doesn't work when the browser is in Incognito
- does the Da Vinci Tools icon in the browser toolbar show a little red X?
- if you can share your website, I can try to see if for some odd reason the GA call isn't being detected (you can email me@StephaneHamel.net to share the details)
- if you open the browser JavaScript console, are there any errors?
- if you enter chrome:extensions in your browser URL bar, it will show all your extensions and you can click on the background page for Da Vinci Tools - you will see messages like this:
Analytics.HideMe: Set to /id=(UA-570276-22)/
Analytics.HideMe: Blocked POST request matching /id=(UA-570276-22)/
Analytics.HideMe: Blocked GET request matching /id=(UA-570276-22)/
Analytics.HideMe: Set to /id=(^$)/

Conditional style formatting in datastudio
To me datastudio is currently lacking proper conditional formating of metrics.
Is it possible to fix this with da vinci tools. It would be great for some metrcis to have the basic possibility to maken the color of numbers red for negatives and green for positives for example.
Done!
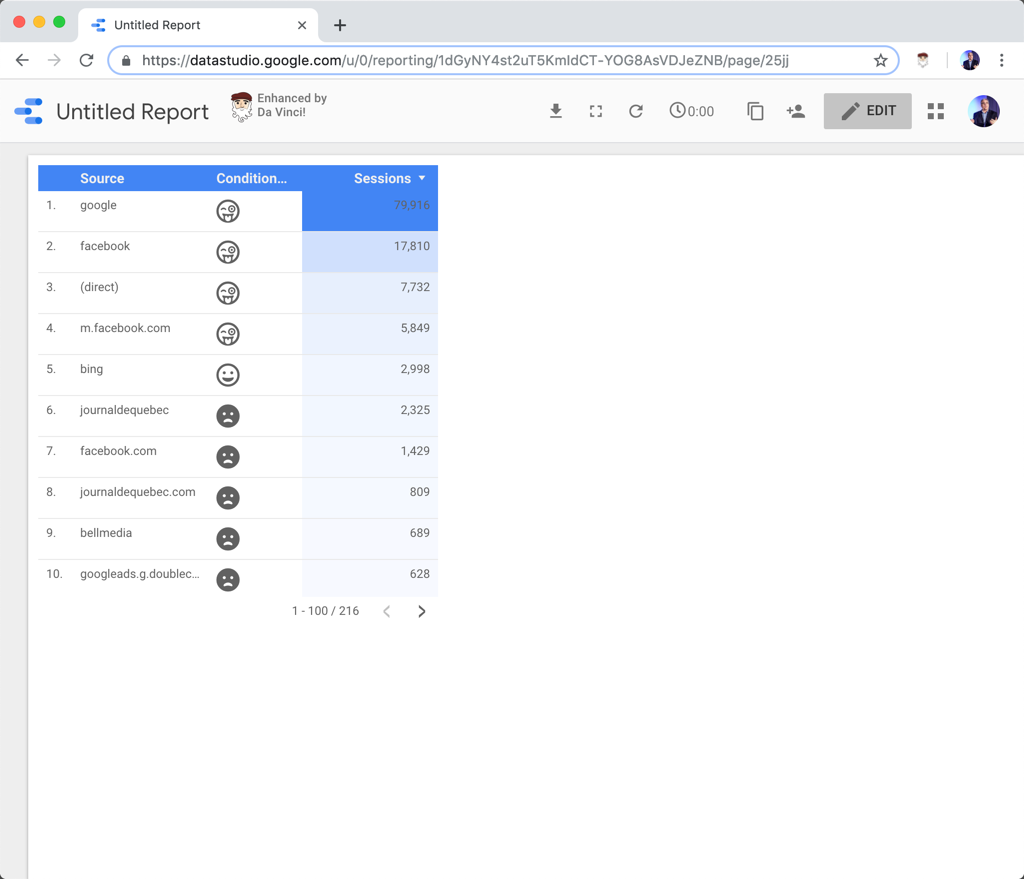
Whenever a string of the format ${font-awesome icon} is found in a dimension, it will be replaced with its corresponding icon. It's not quite conditional formatting, but with calculated fields, you can use icons in a similar way.
So something like ${far fa-grin-tongue-wink fa-2x} will be replaced by the grin-tongue-wink smiley.
Cool isn't it! :)

Transaction refund / reverse not working ?
When I try to cancel a transaction with the (awesome) new function I keep going through the Google Authorization every time process with no effect.
Am I missing something ?
Thanks !
I have solved this problem by simplifying the way the data is retrieved and the measurement protocol call is created. This will be available in the next release, coming up very shortly.
Also, I have introduced the ability to refund/revert a single item of a transaction.
Note those features will eventually be available only to subscribers.

Images are not loading in GTM preview
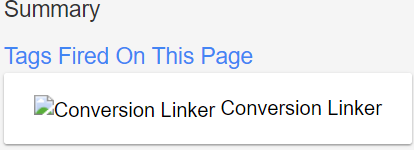
The images that are used in GTM Preview no longer work. See attached screenshot. The link to the images gives a 404.
Example: https://www.davinci.tools/img/icons/ConversionLinker.png

unable to deselect data range comparison in Google Analytics
In google Analytics I had selected a data range comparison with a previous period. When I wanted to click the checkbox to deselect this date comparison I was now unable to do so. Clicking it resulted in the date selector "window" closing.
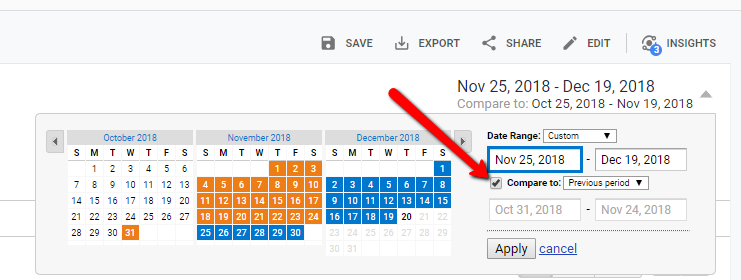
I tried setting the permissions for De Vinci Tools to only be allowed to run, when I click the plugin in Chrome. Then I reloaded the page and tried again (with Davinci Tools now disabled). This time it worked - I could remove the data range comparison in Google Analytics.
I spent a fair amount of time drilling into this problem - assuming it was caused by Da Vinci. Actually, it's not. It seems to be a random problem but I was able to reproduce it when having an active "Compare To" and drilling into a report entry. On the drilled-down report I'm unable to deselect the Compare To flag. Refreshing the page seems to solve it - but maybe not always.
I have recorded a quick demo of this problem: https://www.useloom.com/share/7109439d65ea42e9a4c80a86cc5077d7
If you face this problem again, please use the "Send Feedback" at the bottom of the GA interface to report this problem to the Google team.

Data Studio: time period comparison in all chart types
In Data Studio line charts you can easily select from a drop-down to produce a second line on your chart...e.g. vs last month, vs last year, etc. So it baffles me that this can't be done in, for example, bar charts to product a second set of columns for the comparison. Would be really useful to have this feature irrespective of the chart type.
I can't easily alter the functionality of the current widgets.
However, in the specific case you describe, use a time series chart, under Style, change it to column, and enable the comparison period. Voilà! (unless I have misunderstood your request!)
Customer support service by UserEcho

